Service
The Table™ advanced analytics
Intelligent data infrastructure for real-time campaign performance reporting. Make better decisions faster.

Reporting from integrated advertising campaigns can take up to 17 days – the same time it took the Pony Express to deliver a letter from St. Louis to Sacramento. Advertising teams are wasting up to 1600 hours and $300,000 a year, cleaning and prepping data.
We built the Table to solve that. It gives our teams, clients and partners a clear, current and accurate view of campaign performance. Right now.
What it does
Using cloud technology, the Table pulls data from every channel in the campaign, cleans it up, matches it with performance data, filters it based on custom campaign needs and creates a single, harmonized source of truth.
What you get
A simple, easy, interactive way to monitor performance. Our teams use it to quickly identify trends, manage tests, explore new opportunities and discover new ideas. The Table reduces human effort and maximizes human insight.
It’s not just another dashboard.
(But it’s also a wicked smart dashboard.)
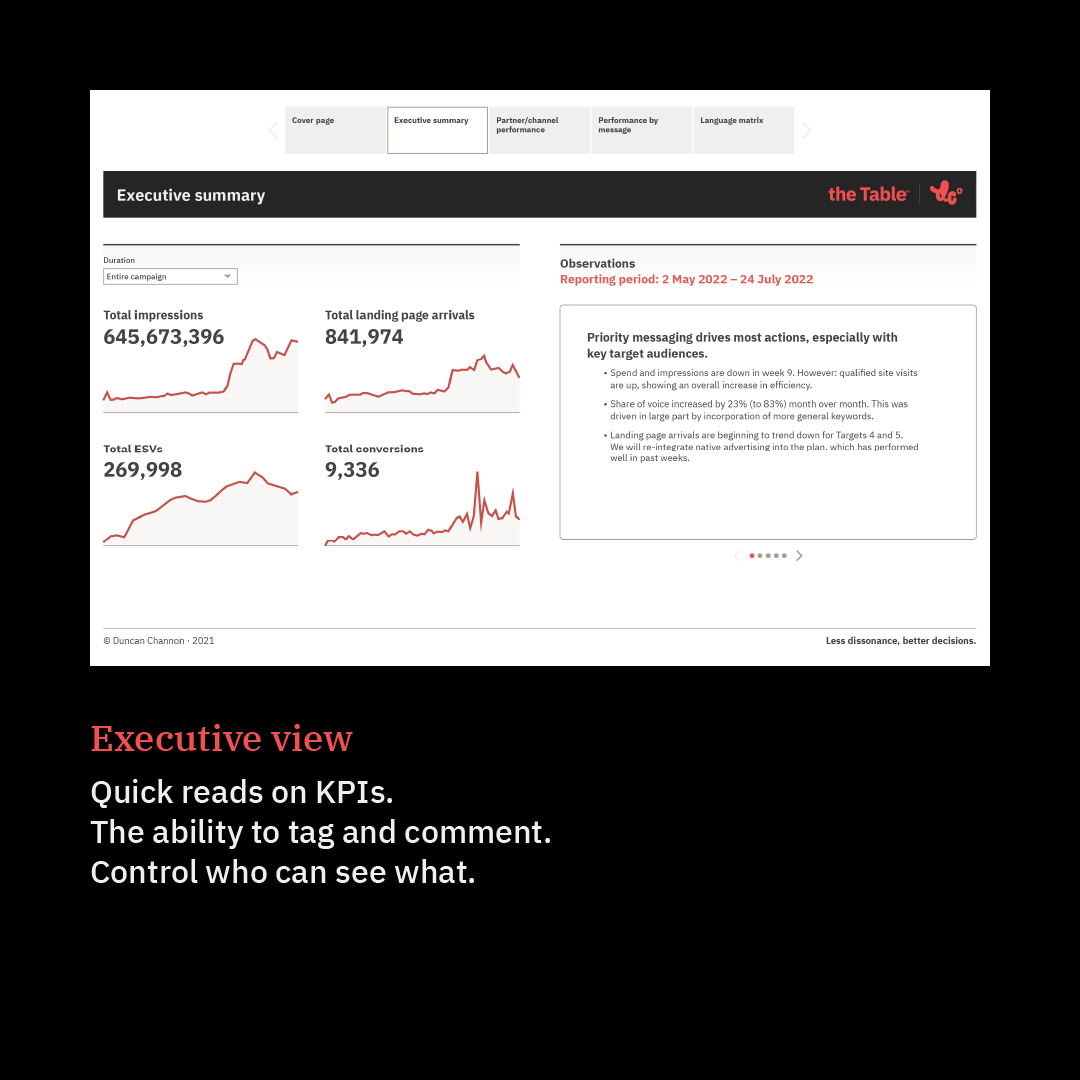
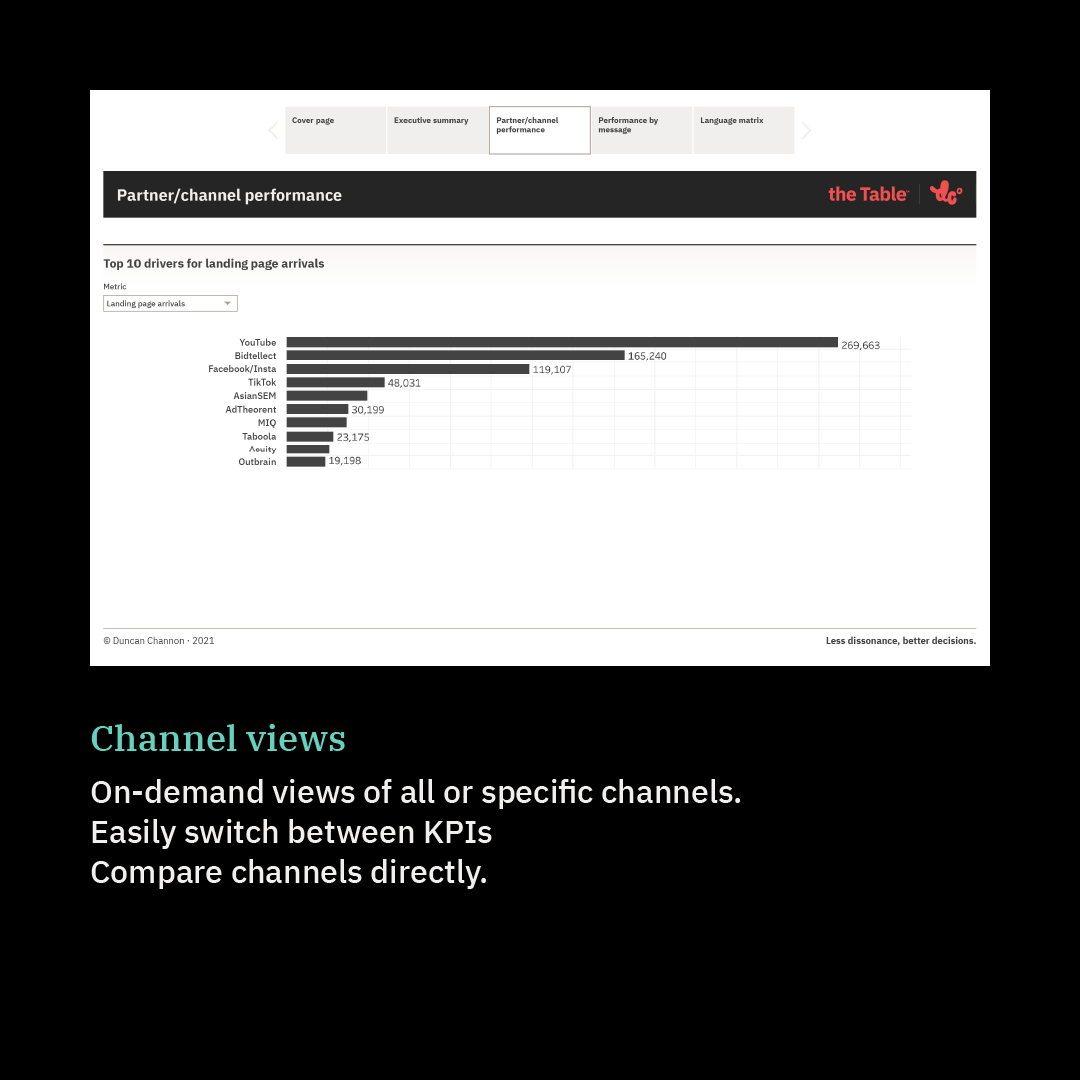
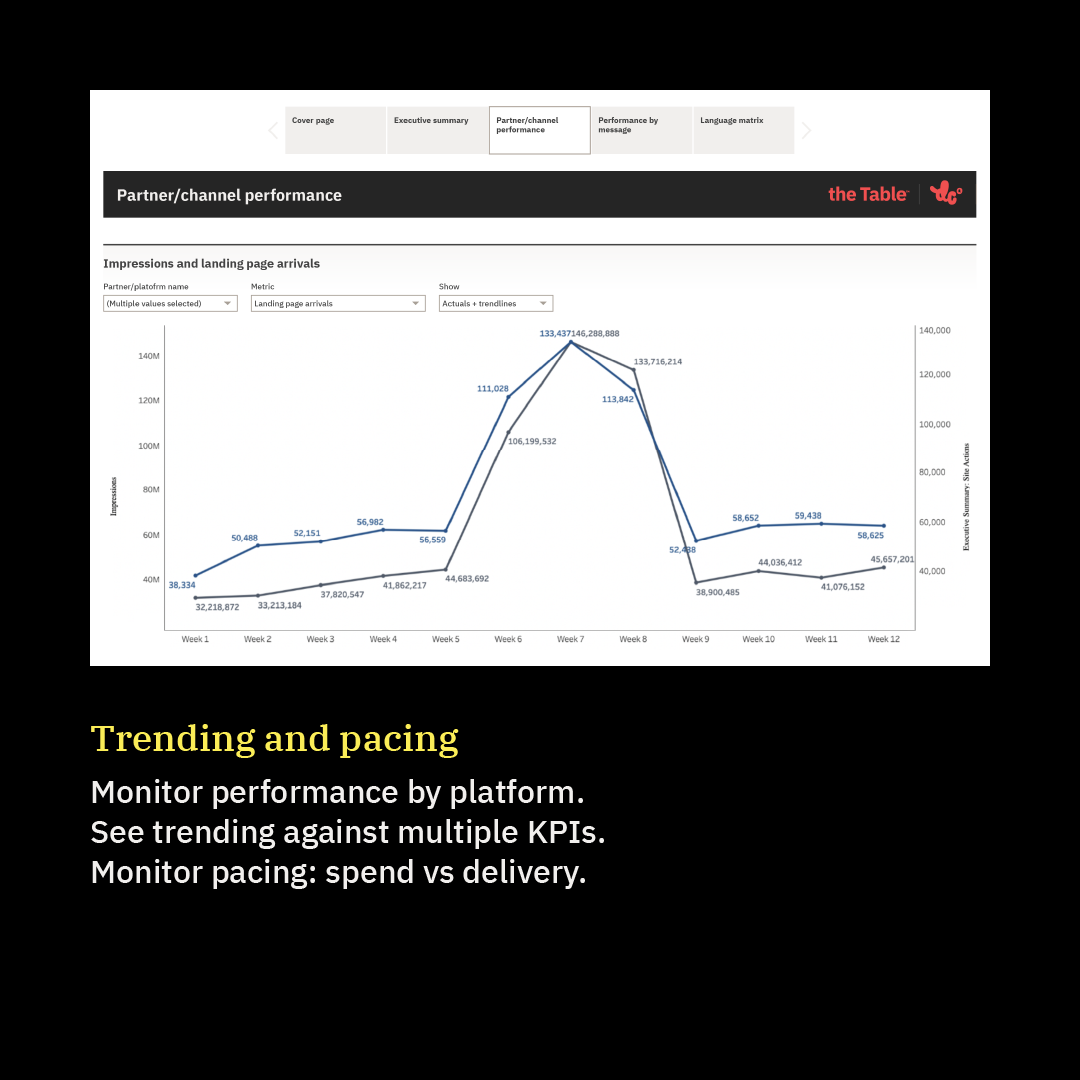
Just a few ways the Table is generating
real value for our clients today —
Compare results across channels, across creative
Is that video doing better on social or CTV? Data is rolled up and normalized so you can run a side-by-side comparison, then dive deeper to see how each platform within the channel is performing.
Integrate third-party data to enhance the campaign
Once the media data is clean, it becomes easy to pull in other, external data sources to help segment and target. Add weather data or employment stats to deepen your understanding or drive greater effectiveness.
Align performance and brand metrics into a single view of success
If you’re running a brand-tracking or consumer-satisfaction study, the results from that research can be pulled in directly and plotted against impressions, spend or any other campaign metrics.
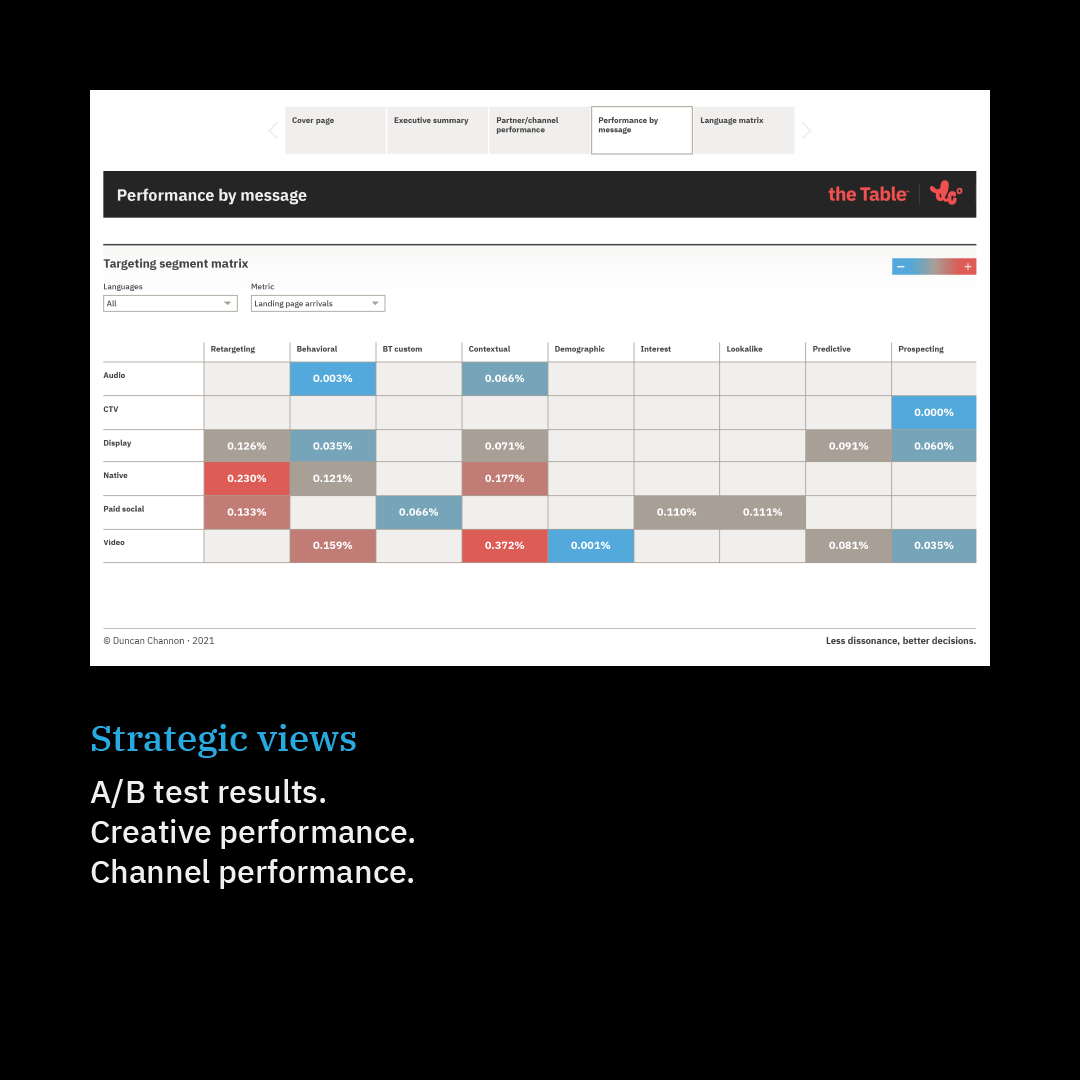
Map message performance against audience and channel
View KPIs for messages against different audiences or channels to quickly spot where “right person, right message, right place” is working, and where it isn’t.
Create a collaborative space that makes meetings way more efficient
Our teams, clients and partners all log in the Table. Teams can explore the data and leave comments for each other in the dashboard. The result is reporting meetings that are fast, efficient and focused on action (not on sorting through complicated spreadsheets).
Make better decisions faster.
Contact us today for a quick demo.
Work + News
Contact Us
New business
NOËL JOHNSON
Dir of marketing and client engagement
njohnson@duncanchannon.com
415 306 9237
Jobs, creative
TINA MONTEMAYOR
Dir of creative talent acquisition + equity
tmontemayor@duncanchannon.com
415 306 9282


